A pulse sized on a blanket wafer is 40× too short for a 3D-NAND wafer.
A 3D-NAND wafer carries 56 times the surface area of the wafer under it, and all of it has to saturate in one pulse. This is a 300 mm showerhead ALD chamber in OpenFOAM in which every point on the wafer runs its own feature-scale model of a hole, coupled both ways to the gas. The answer it gives is one line of arithmetic, and it reproduces a measured saturation time on 940 m² of powder.
longer pulse for the patterned wafer than the blanket wafer it was tuned on: 14.05 s against 0.345 s
0.0×
wall area over wafer area for 100 nm holes at aspect ratio 100, 14 % open area, half the wafer patterned
0%
the rule holds within this over aspect ratios 20 to 100 and a 20× range of precursor feed (12 chamber runs, 1.05 to 1.27× the supply limit)
0.00
measured saturation time over supply-limit time for a fluidized-bed ALD run on 940 m² of silica gel (Argonne, 2022)
01 · The wafer is not blank
A chamber model in which every wafer face runs its own hole.
The chamber is an axisymmetric wedge of a 300 mm showerhead reactor: N₂ at 300 Pa and 573 K, 300 sccm, Reynolds number 0.045, a total-flux (Danckwerts) inlet so the TMA entering is exactly what the showerhead delivers. The wafer is a custom OpenFOAM boundary condition: on each of its 150 faces a one-dimensional Knudsen-diffusion, Langmuir-adsorption model of a 100 nm hole of aspect ratio 100 is advanced every time step from the local gas density, and its uptake is returned to the gas as a mixed boundary condition. Flat and hole fluxes blend by open-area fraction. Nothing is fitted to the chamber; the hole model sits within 3 to 11 % of the converged ballistic reference (Argonne's Machball and this repository's own 3D voxel Monte Carlo solver, which agree within 2 %) and was fitted to published lateral-structure thickness profiles.
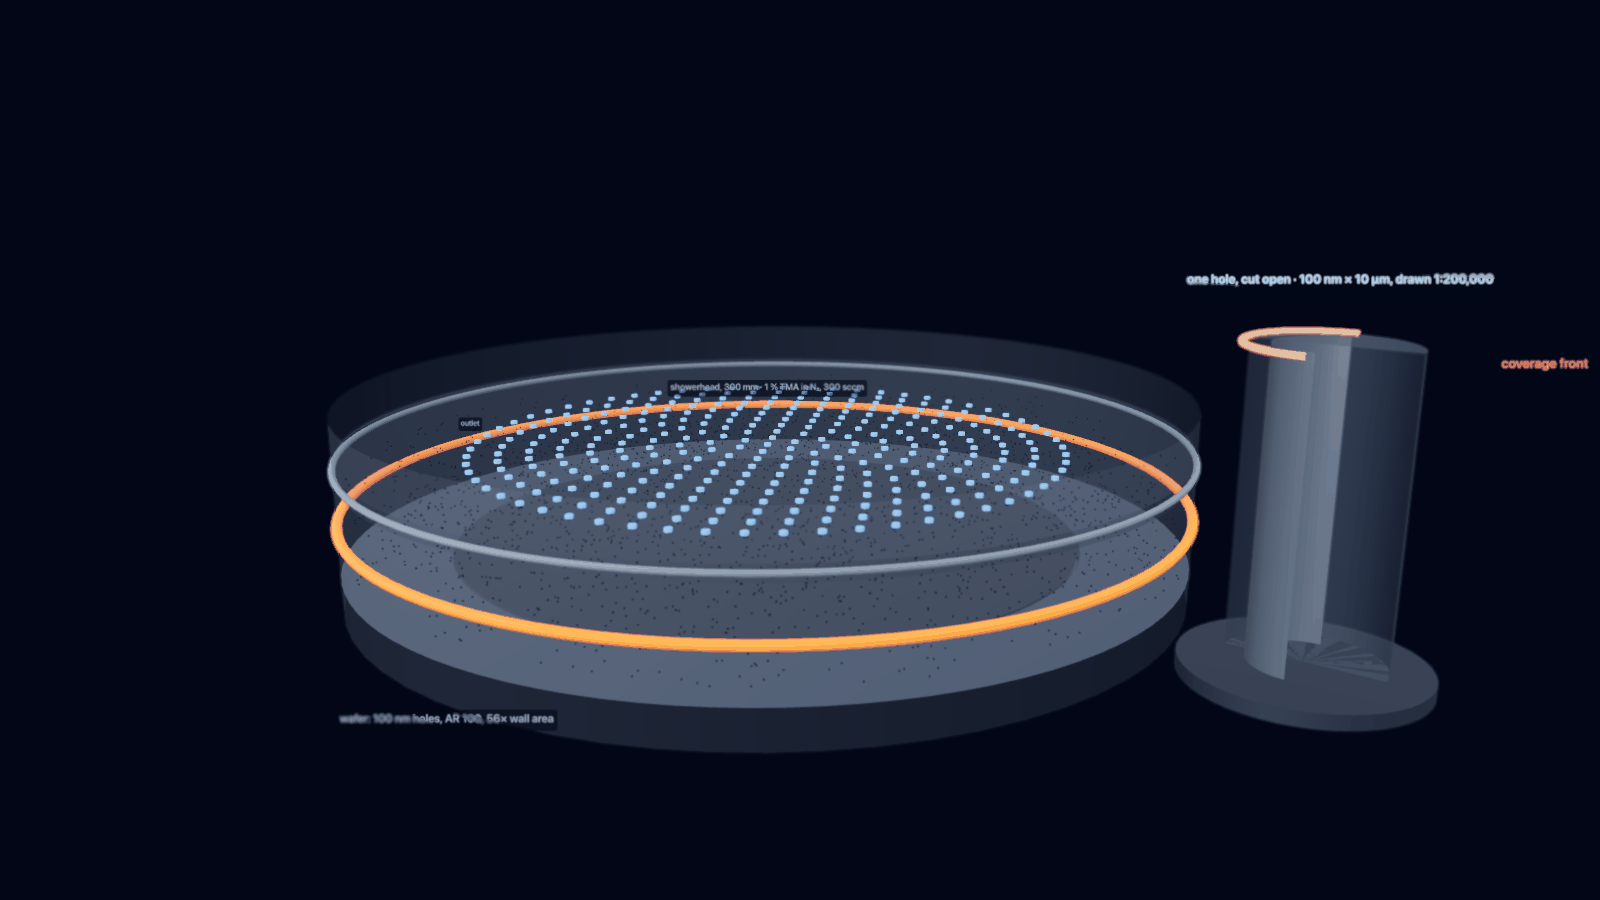
The chamber and the pattern, explodedshowerhead, 300 mmwafer, 150 facesone hole model per faceoutlet at r = 200 mm
6,000 cells, 5° wedge, 15 mm gap (drawn 3× for legibility). The magnified patch is the pattern every face carries: 100 nm holes at 180 nm hexagonal pitch, half the wafer patterned. Drag to orbit.
Layer
Tool
What it does
Chamber flow
OpenFOAM v2606, simpleFoam
steady N₂ flow through the 15 mm gap; frozen for the pulse
Precursor pulse
scalarTransportFoam
TMA as a passive scalar with Chapman–Enskog diffusivity; Danckwerts inlet
Wafer
aldWallKinetics (C++)
langmuirSticking for blanket wafers, patternedSurface with one hole model per face
Feature
aldconf (Python)
standalone Knudsen/Langmuir solver: fits, plasma recombination, two-species kinetics; lib/aldmc adds a 3D voxel Monte Carlo solver cross-checked against Machball
Statistics
JMP 19, MATLAB R2025b, scikit-learn
25-run response surface, Gaussian-process surrogates, Monte Carlo
Why two-way coupling matters
A patterned wafer is a sink 56 times stronger than a blanket one. One-way coupling (chamber first, hole after) misses the depletion of the gas over the wafer; here the hole uptake feeds back into the gas every time step, and the embedded model agrees with the standalone solver driven by the same face concentration to within 1 % at all times (the 14.05 s saturation is reproduced by both). The flat surface between the holes, which saturates in 0.35 s on a blanket wafer, takes 1.95 s here because it shares the precursor with the holes.
02 · One rule
The saturating pulse is 1.2 times one monolayer of supply to the patterned area.
Twelve patterned runs over aspect ratios 20, 50 and 100 and TMA fractions from 0.5 to 10 % all land between 1.05 and 1.27 times the time the showerhead needs to deliver one monolayer to the whole patterned area. Blanket wafers do not: they sit at 1.5 to 4.3 times, because on a blank wafer the sticking coefficient, not the supply, sets the time. Patterned wafers are supply-limited, and that is what makes the rule simple.
tpulse ≈ 1.2 × (1 + Awall/Awafer) × N0 / (U · c0) N₀ sites per m², U c₀ precursor molecules per m² per second at the showerhead
The pulse-time mapblanketAR 20AR 50AR 100supply limit
Time for the worst hole bottom on the wafer to reach 90 % coverage, 16 chamber runs. The thin blue ribbons are the supply limit (1 + Awall/Awafer) N₀/(U c₀) for each aspect ratio. Hover a point.
TMA fraction
blanket
AR 20
AR 50
AR 100
Saturating pulse in seconds, worst point on the wafer, from figures/pulse_time_map.csv. Doubling the hole depth doubles the pulse; doubling the precursor fraction halves it. Pressure and gap do not enter the rule; carrier flow and TMA fraction enter only through U·c₀, the rate the showerhead delivers precursor.
What an under-dose looks like on the waferpulse cut at 8 s10 s12 s14 s
Hole-bottom coverage across the wafer if the pulse stops early. The deficit is nearly flat across the radius (edge lag 0.4 % at this operating point), because the whole wafer is starved by the same supply. Uniformity in supply-limited ALD is about when you stop, not where the gas goes.
02b · The wafer is not uniform either
Size the pulse on the densest region, not the wafer average.
Real device wafers mix dense arrays, open field and tiers of different depth. The boundary condition takes the hole density and aspect ratio as functions of radius, so two layouts were run: a dense AR-100 array in the centre with bare wafer beyond 100 mm, and a wafer whose hole depth ramps from AR 100 at the centre to AR 60 at the edge. The rule evaluated with the wafer-average wall area under-predicts both (5.1 s against 11.85 s needed; 10.6 s against 12.5 s). Evaluated with the local wall-area ratio of the most demanding region it is conservative by 15 to 21 %, the surplus being precursor the less-demanding neighbourhood feeds back laterally. The showerhead supplies molecules per unit area, so the local ratio is the one that counts.
Saturating pulse across the wafer for three layoutsuniform AR 100dense centre, bare edgeAR 100 → 60 ramp
Hole-bottom time to 90 % coverage against radius. A pattern boundary puts a 26 % saturation gradient inside the array (11.85 s at the centre, 8.75 s at its outer edge) where the uniform wafer varies by 0.4 %. The bare edge is itself 15 to 30 % slower than a blanket wafer because the array drains the gas. Hover.
Layout
wall ratio, wafer avg.
rule, wafer avg.
rule, local
needed
Uniform AR 100
55.9
14.4 s
14.4 s
14.05 s
Dense centre (r < 75 mm), bare beyond 100 mm
19.2
5.1 s
14.4 s
11.85 s
AR 100 at the centre → 60 at the edge
41.0
10.6 s
14.4 s
12.5 s
A 40 % tier-to-tier depth variation gives a 39 % spread in saturation time (12.5 s at AR 100, 7.6 s at AR 60): the recipe is set by the deepest tier and the shallower ones are over-dosed by their depth ratio. The uniform path of the boundary condition was regression-checked to the eighth digit after the change. Files: figures/pattern_layout.csv, reactor/make_layout_cases.py.
03 · Checked against measurement
Wafers and powders on one curve.
The same normalisation puts a measured fluidized-bed ALD run (Argonne, 10 g of silica gel, 940 m²) at 1.12 supply-limit times, inside the 1.05 to 1.27 band of the chamber runs, and orders the measured precursor utilization of a rotary-drum reactor with its loading. Precursor utilization against total reactive area spans five orders of magnitude on one curve. Separately, the hole model fits the published saturation profiles from 500 nm lateral test channels; the fitted TMA sticking coefficient depends on the slit transport assumed, 8.5 × 10⁻³ with the hydraulic diffusivity and 2.0 × 10⁻² with the ideal-plate correction, both with the same residual, so the profile alone does not pin s.
Utilization = 1 / (saturation time over supply-limit time). Fluidized bed: Lu et al., JVST A 40 (2022). Rotary drum: Coile et al., JVST A 38, 052403 (2020), Table 2. Hover a point.
The hole model against measured profilesZenodo 3974438, 8 profilesfit, hydraulic slit transport, s = 8.5e-3fit, ideal-plate transport, s = 2.0e-2s = 1e-3 and 1e-2
Al₂O₃ from TMA/H₂O at 300 °C, 500 cycles of 0.1 s, 500 nm lateral channel (Puurunen and Ylivaara, Aalto, CC BY 4.0). Two fits with the same residual (rms 0.038 of the plateau): s = 8.5 × 10⁻³ at 75 Pa with the hydraulic Knudsen diffusivity, s = 2.0 × 10⁻² at 32 Pa with the ideal-plate correction the 3D solver showed is needed for slits (the real cavity, 140 to 200 gaps wide and pillar-supported, sits between the two). Hover.
The chamber runs use s = 5 × 10⁻³; Arts et al. report 0.5 to 2 × 10⁻³ from the same kind of structure. The patterned-wafer conclusions are supply-limited and do not move with s. The blanket-wafer numbers do, and are quoted with that caveat.
04 · Inside the hole
The front moves down one monolayer at a time.
One hole at the wafer centre, driven by the gas density the chamber model computes at its mouth. Coverage is a front: the mouth saturates in the first second, the front marches down as the supply arrives, and the bottom sees nothing until the walls above it are full. Stop the pulse at any time and the depth of the front is the depth of the film.
One hole, aspect ratio 100, cut open
t = 0.5 s
0% at the bottom 0% of depth coated
0.5 s: the mouth
On a blanket wafer this is already saturation. Here the first 3 % of the depth is coated and the gas over the wafer has dropped to a fraction of the showerhead value: the holes are draining it.
2 s: the flat surface is done
The surface between the holes reaches 90 % at 1.95 s, late by blanket standards because it competes with the holes. Inside, the front is a tenth of the way down.
5 s: one third
The front is at a third of the depth and moving at a steady pace: the rate at which the showerhead delivers molecules, divided by the wall area still to fill.
10 s: two thirds
Nothing about the chamber has changed; the front is simply where the supply integral puts it. Pressure or gap would not move it. Precursor fraction would.
14 s: the bottom reaches 90 %
14.05 s at the centre, 14.10 s at the worst point on the wafer. The rule said 14.4 s. On a blanket wafer the recipe would have stopped 13.7 s earlier.
05 · Which knobs matter
Precursor delivery sets the time. Pressure and carrier flow set what it costs.
A face-centred central composite design, 25 OpenFOAM runs over TMA fraction (0.5 to 3 %), carrier flow (150 to 600 sccm), pressure (100 to 1,000 Pa) and gap (10 to 25 mm), fitted in JMP: log₁₀ of the saturating pulse scales as x⁻¹·⁰ Q⁻⁰·⁸ p⁻⁰·¹², R² 0.993, and the gap term is not significant. Utilization of the delivered precursor runs from 51 to 97 %: pressure up and carrier flow down raise it, because a slower gas spends longer over the wafer. A Gaussian-process surrogate on the same 25 runs (MATLAB fitrgp, leave-one-out R² 0.999 on time and 0.988 on utilization) finds the operating point that uses the same precursor supply as the centre and saturates faster.
The response surface100 Pa316 Pa1,000 Pa
log₁₀ t₉₀ from the JMP fit at the centre pressure and gap, with every run as a sphere. Pressure moves a point off the surface by at most ×1.15; gap by less than the fit's residual. Hover a run.
Cost of ownership: precursor per wafer against pulse timethe 25 runssurrogate front, edge lag ≤ 5 %
Precursor use is 1 / utilization: how many times the stoichiometric minimum the showerhead had to deliver before the deepest hole saturated. Hover a run.
Operating point (GP surrogate)
TMA
carrier
pressure
gap
pulse
edge lag
utilization
Centre of the design
1.22 %
300 sccm
316 Pa
17.5 mm
11.6 s
−0.2 %
85 %
Same precursor supply, edge lag ≤ 5 %, fastest
2.51 %
150 sccm
631 Pa
10 mm
9.8 s
0.9 %
94 %
Fastest anywhere in the box, edge lag ≤ 5 %
3.00 %
600 sccm
1,000 Pa
10 mm
2.4 s
1.0 %
85 %
Monte Carlo on the rule's one uncertain constant, the site density N₀ (log-normal, ×/÷ 1.25, 10,000 draws): the 11.9 s centre-point pulse carries a 90 % band of 8.2 to 17.2 s. That band, not the chamber geometry, is what a recipe transfer has to absorb. Reports: figures/doe_rsm_report.txt, figures/doe_gp_report.txt.
06 · Try it
Your wafer, your chamber, the rule and the surrogate.
The rule needs the pattern and the showerhead supply. The surrogate is the Gaussian process fitted to the 25 chamber runs, evaluated here in the browser from the exported hyperparameters; it is only meaningful inside the design box, and the page says so when you leave it.
—wall area / wafer area
—one monolayer of supply, s
—rule: saturating pulse for the deepest hole, s (1.2 × supply time)
—surrogate: pulse, s (GP on 25 runs; ×/÷ sd shown)
—surrogate: precursor utilization
—surrogate: centre-to-edge lag, %
—precursor delivered per saturating pulse, monolayers of the patterned area
Same arithmetic as python -m aldconf rule … and python -m aldconf surrogate … in the repository. U is the showerhead face velocity from the carrier flow at the chamber pressure and temperature; c₀ is the TMA number density at the inlet.
07 · Water, plasma, spatial
The rule has consequences past the TMA pulse.
Water: same pulse, 50× less reactivekdes 00.1 /s1 /s10 /s
On the patterned wafer the H₂O half-cycle (s = 10⁻⁴) saturates in 13.4 s against 14.05 s for TMA: supply, not kinetics, again. With reversible adsorption above about 0.3 /s the surface cannot reach 90 % at 1 % H₂O, and the desorbing water keeps the exhaust wet through the purge.
Plasma: the recombination ceilinglargest AR reached in 5 sAR 100
Radicals lost on every wall collision cannot be bought back with dose: at a recombination probability above about 3 × 10⁻³, aspect ratio 100 is unreachable in any exposure. Measured values for O on SiO₂ and TiO₂ sit near 6 × 10⁻⁵ (Arts et al.).
Temporal against spatial ALDtemporal, 1 % and 3 %spatial, zone 10×30×100×
Cycle time from the rule for a temporal tool (two half-cycles plus two 0.5 s purges) and for a spatial tool whose precursor zone runs at an assumed 10 to 100× the showerhead flux. The zone flux is assumed, not measured; the shape of the comparison is not.
08 · What does not move it, and what is not settled
Nine things that were supposed to matter.
Saturating pulse for the AR-100 wafer under every idealization removedwithin one write interval of 14.05 swater half-cycle
Edge ring, wafer temperature at fixed sccm and fraction, and hole diameter at fixed wall area each change the saturating pulse by less than one write interval (0.05 s). Hover a bar.
Open items, stated
The TMA sticking coefficient from the PillarHall profile is 8.5 × 10⁻³ to 2.0 × 10⁻² depending on the slit transport assumed, above Arts et al.'s 0.5 to 2 × 10⁻³; the chamber runs used 5 × 10⁻³, and section 11 shows the patterned-wafer results do not move across that whole range. The water model is single-site with one desorption constant. The spatial-ALD comparison rests on an assumed zone flux. The chamber is a wedge; azimuthal showerhead non-uniformity is not in it. Every one of these is listed with the run that would close it in paper/assumptions.md.
What the rule is not
It is not a kinetics model: on a blanket wafer it under-predicts the pulse by 1.5 to 4×, because there the sticking coefficient sets the time. It applies when the wafer's wall area is large enough that the chamber, not the surface, is the bottleneck, which is every production wafer with a 3D array on it.
09 · Reproduce it
Every number from a script, on a laptop.
git clone https://github.com/Soham-ChemE/ald-conformality.git && cd ald-conformality
python3.12 -m venv .venv && .venv/bin/pip install -e . && PYTHONPATH=src .venv/bin/python -m pytest -q tests
# chamber: OpenFOAM v2606 (gerlero/openfoam-app on Apple silicon), then
cd reactor/lib/aldWallKinetics && wmake && cd ../.. && ./Allrun          # steady flow, blanket pulse, Langmuir wafer
python sweep_pattern_map.py && python doe_patterned.py                        # the 16-run map and the 25-run DOE
python ../analysis/make_doe_jsl.py && ../scripts/run_jsl.sh ../analysis/doe_rsm.jsl   # JMP response surface
matlab -batch "run('../analysis/doe_gp.m')"                                   # MATLAB GP, optimum, Monte Carlo
python ../docs/build_assets.py                                                # this page's data and figures
129 tests (pytest --collect-only -q tests). The same tests, the two C++ libraries with their Python bindings, the OpenFOAM chamber chain in a container and the page assets run in GitHub Actions on every push:
The validation data (Zenodo 3974438) ships in data/; the Argonne numbers are quoted from the papers. CLAIMS.md maps every number on this page and in the paper to the file that produces it. The paper: draft 0.9, LaTeX in paper/.
11 · The reviewer's questions, answered with runs
Sticking coefficient, fab units, chamber-scale checks, a 3D chamber, device geometry, other chemistries.
Seven questions any reviewer or process engineer would ask, each answered with new runs rather than argument. Every scene below is drawn from the repository's own data files; the numbers in the captions trace to CLAIMS.md, and the audit figure behind each scene is linked.
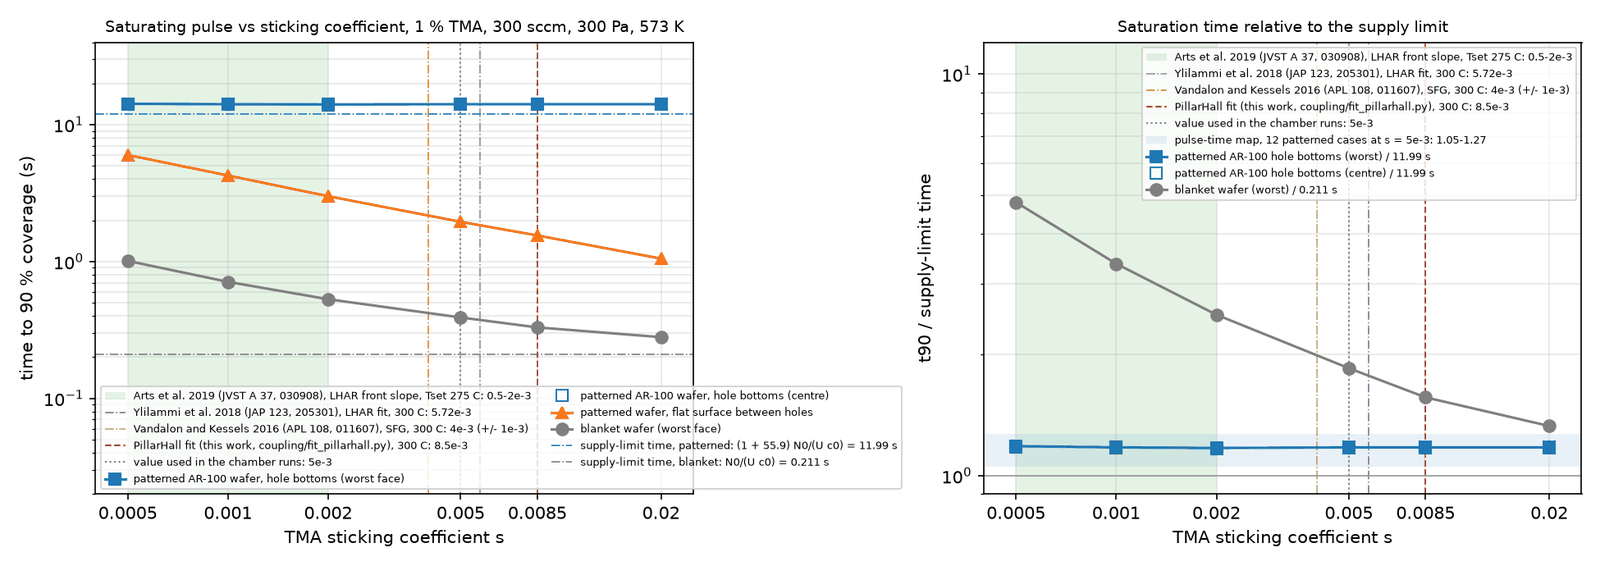
Does the rule depend on the sticking coefficient?blanket waferflat surface between holeshole bottomssupply limits
No. Across s = 5 × 10⁻⁴ to 2 × 10⁻², the published TMA values and both PillarHall fits of section 08, the AR-100 wafer saturates in 14.00 to 14.20 s, 1.17 to 1.18× the supply limit. The blanket wafer (0.28 to 1.01 s) and the flat surface between the holes (1.05 to 6.0 s) carry a factor-4 uncertainty; the rule and the map do not. Eleven chamber runs. Hover a point. Audit figure.
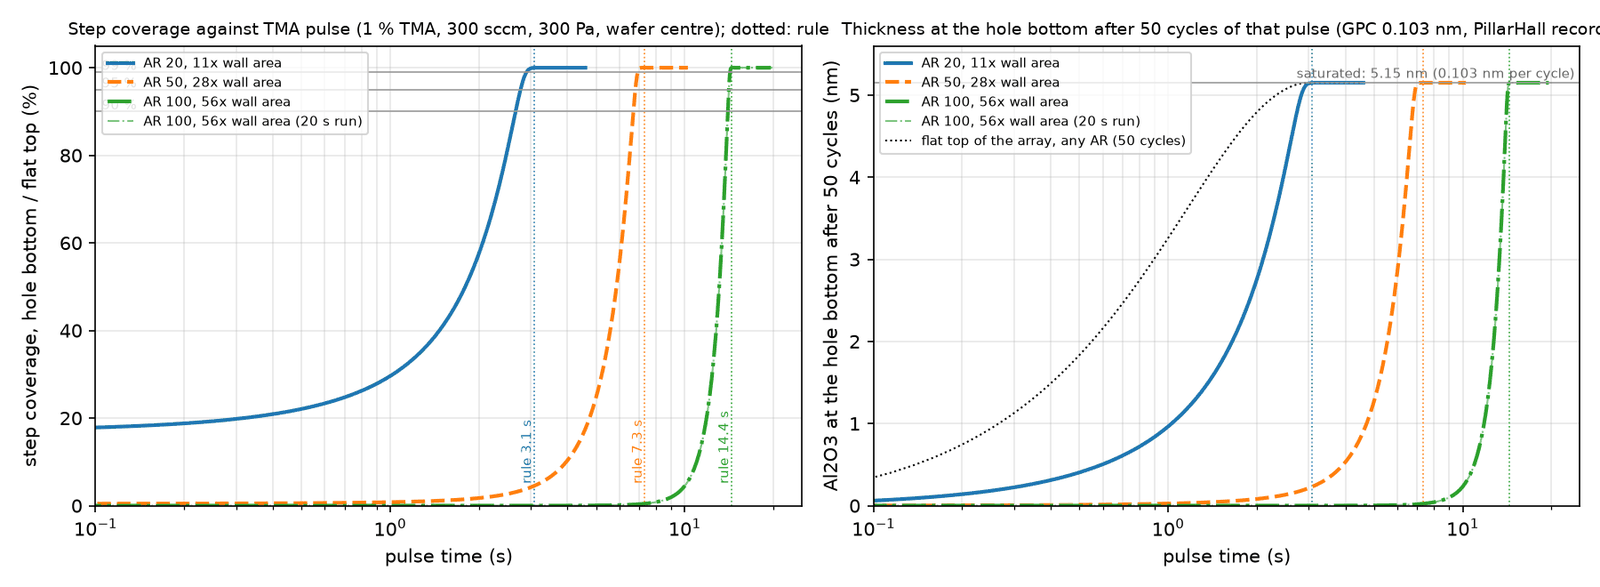
In fab units: step coverage and thicknessAR 20AR 50AR 100
The rule's pulse gives 99 % step coverage, not just 90 %, because the saturation front is 0.3 s wide at every aspect ratio. Fifty cycles of a blanket recipe leave 1.4 nm of a 5.15 nm film on top of an AR-100 array and nothing at the bottom. Audit figure.
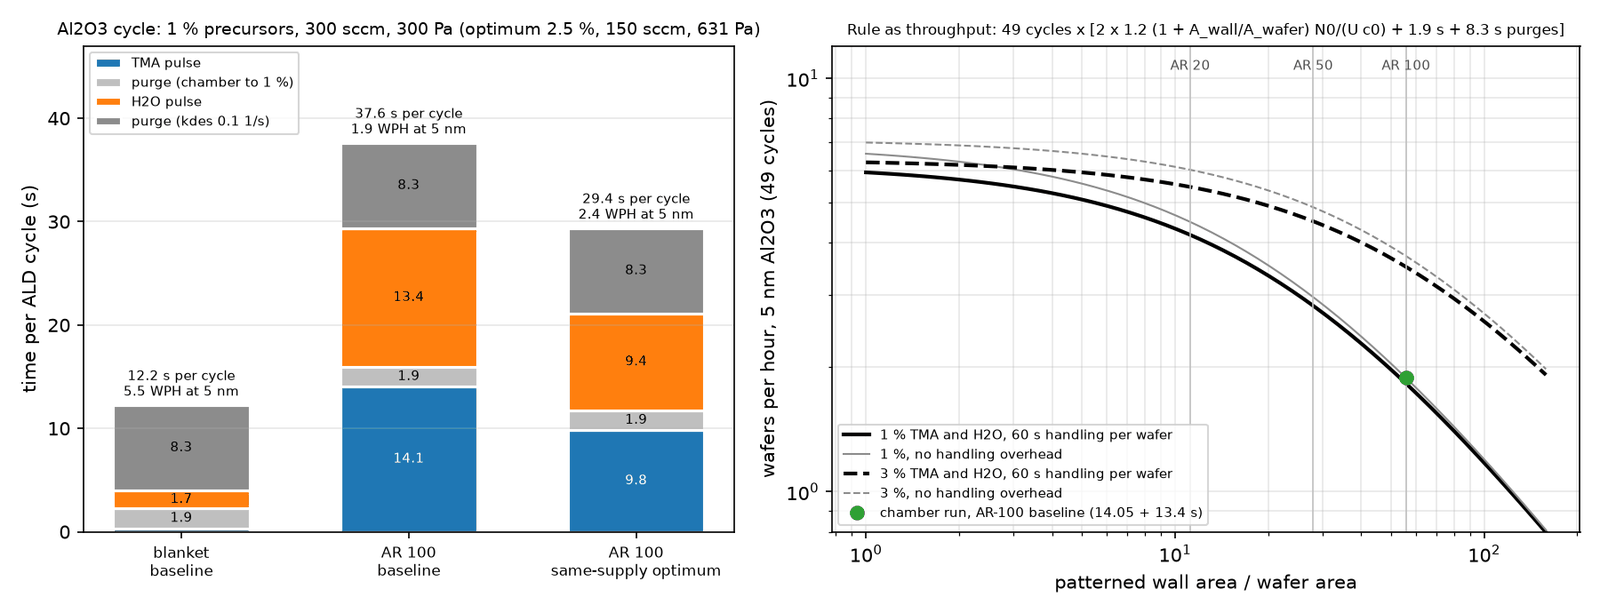
The Al₂O₃ cycle, segment by segmentTMA pulsepurge to 1 %H₂O pulsepurge, water desorbing
The purge is not the hole's doing: a 10 µm hole empties in 14 µs by Knudsen diffusion, the chamber reaches 1 % of the pulse-end signal in 1.9 s, and desorbing water can hold the exhaust up for 8 s at a desorption constant of 0.1 /s. An Al₂O₃ cycle is 12 s on a blanket wafer and 38 s on the product wafer: 5.5 against 1.9 wafers per hour for 5 nm. This is why high-aspect-ratio thermal ALD in production runs in batch vertical furnaces (100 or more wafers per load) or multi-station chambers: the long pulse is paid once for many wafers. Hover a segment.
The rule as throughput1 % TMA and H₂O3 %the chamber run
Above a wall-area ratio of about 10, throughput falls as 1/(1 + Awall/Awafer) and precursor fraction is the only knob that moves it; tripling the fraction doubles AR-100 throughput and leaves the blanket wafer unchanged. The point is the chamber run, on the curve. Audit figure.
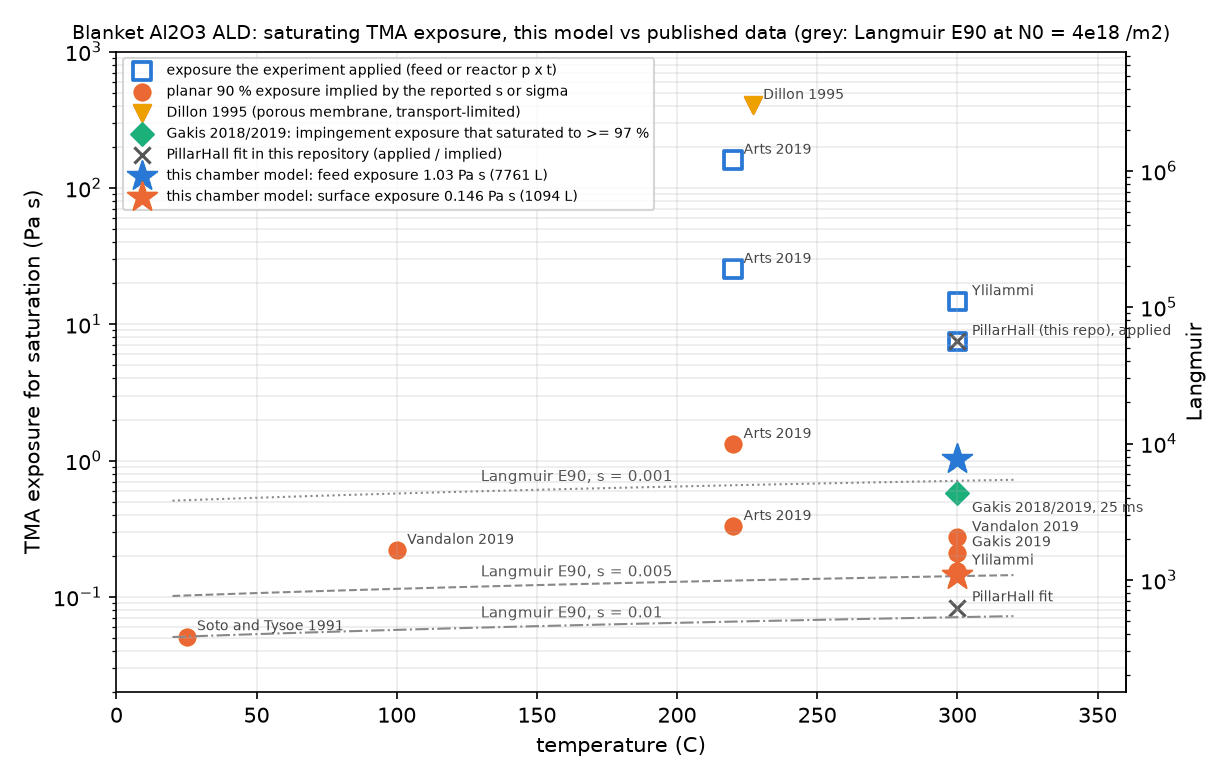
Does the blanket number sit where published data sit?this modelkinetic, from a reported sapplied doseCFD exposure
On the like-for-like basis (the exposure the surface actually sees, 0.146 Pa·s, 1,090 L) the blanket wafer sits within a factor 1.8 of the three 300 °C sources with an explicit sticking coefficient. The feed exposure is 7× larger because the wafer draws the gas down, and published feed exposures are inflated the same way. Hover a point for its source. Audit figure.
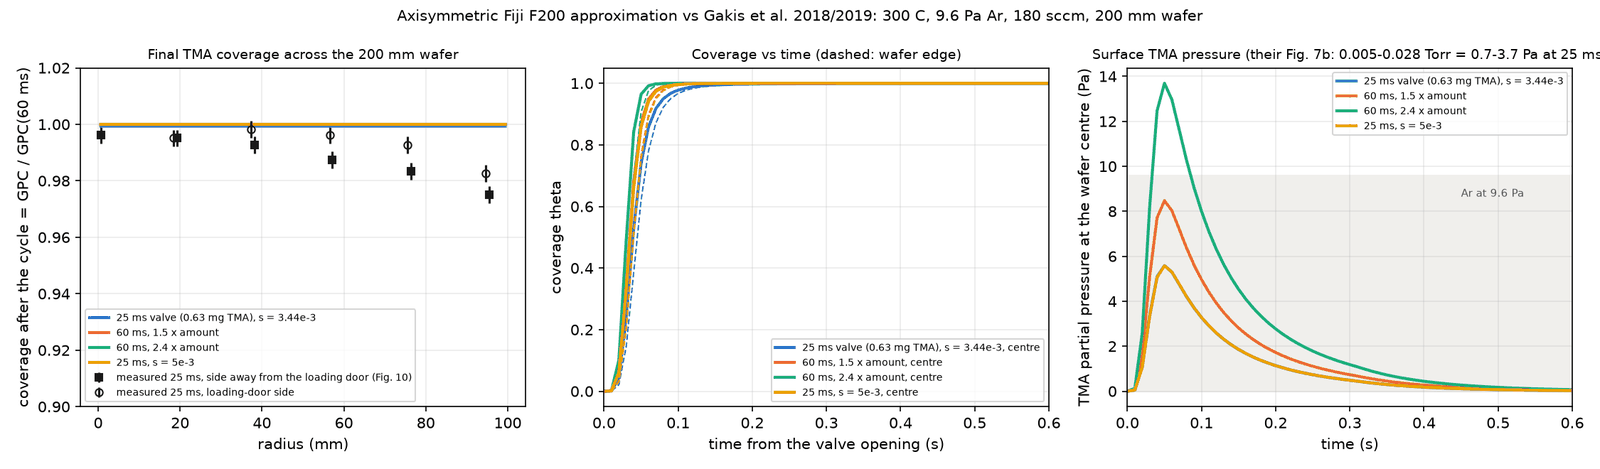
A published reactor, reproduced where it can be25 ms, s 3.4e-360 ms, 1.5× amount60 ms, 2.4×25 ms, s 5e-3measured, Gakis 2019
Gakis et al. (2018, 2019) ran 3D CFD of TMA/H₂O in a Fiji F200 and measured thickness maps. In an axisymmetric approximation of their reactor, the TMA exposure delivered per 25 ms pulse agrees with their CFD to 12 to 22 % (0.67 against 0.55 to 0.60 Pa·s) and the saturation state matches the measured growth per cycle. Their 2.4 % measured non-uniformity is not reproduced: it comes from an off-axis inlet, a loading-door purge and a 21 °C wafer temperature gradient that a single-inlet frozen-flow wedge cannot carry. Stated, not hidden. Audit figure.
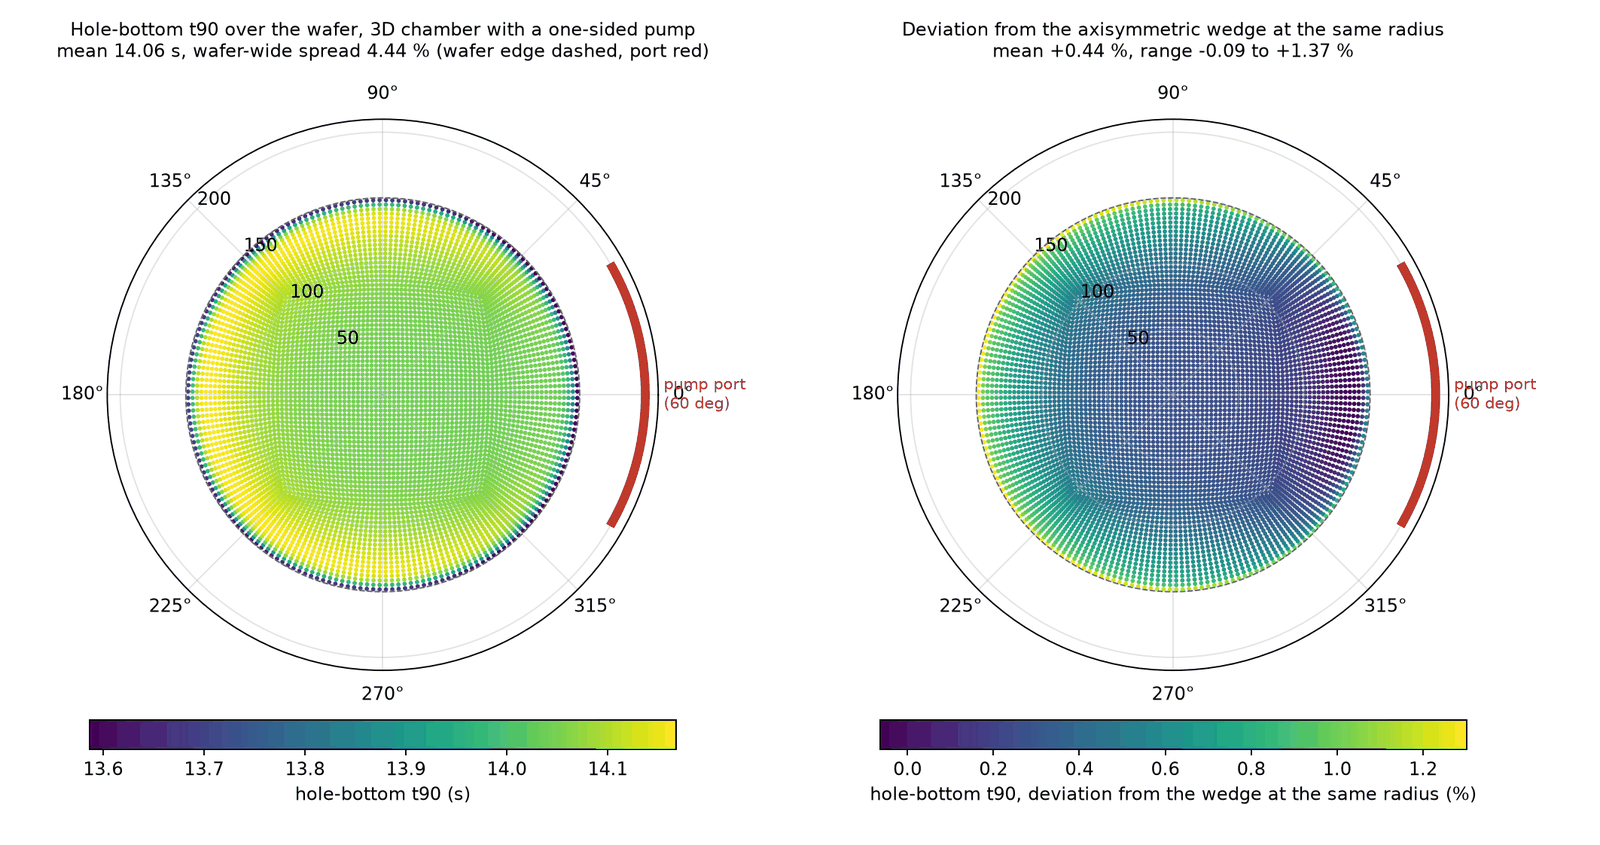
What a one-sided pump does that the wedge cannot seepump port, 60°
A full 3D chamber (106,000 cells, 60° pump port, 32 minutes for the pulse) with the same patterned wafer. The carrier flow is strongly one-sided (the port-side quadrant drains at 3× the axisymmetric speed) and the gas-side quantities follow at the 10 % level, but the saturation time integrates the supply: worst point 14.17 s on the far side against 14.05 s in the wedge. A one-sided pump costs about 1 % of pulse time; the rule's 1.2 covers it. Drag to orbit, hover a face. Audit figure.
Saturation time around the waferr = 50 mm100 mm140 mm
Azimuthal spread 0.09 % at r = 50 mm, 0.37 % at 100 mm, 0.96 % at 140 mm: a single lobe, earliest at the port, latest opposite it. The flat surface, saturating at 2 s under a strongly drawn-down gas, is the more sensitive indicator (4.8 % spread at 140 mm).
Other chemistries, by the same ruleAl₂O₃ / TMAHfO₂ / TDMAHTiN / TiCl₄W / WF₆
The rule is chemistry-agnostic through s, N₀ and c₀: HfO₂ from TDMAH 9.96 s (the chamber run gives 11.6 s, 1.17×, the excess mostly the 2.3× lower gas diffusivity), TiN from TiCl₄ 4.4 s, W from WF₆ 57 s. Per nanometre of film the pulse scales with the metal-atom density. Literature inputs and their caveats in the hover.
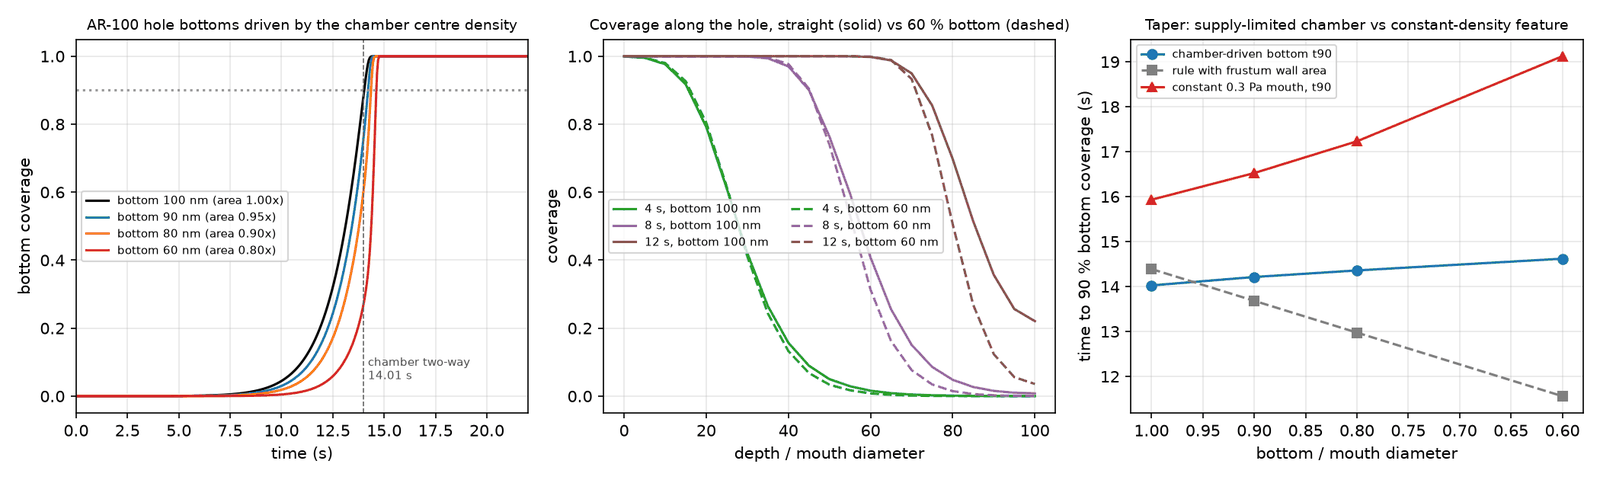
Tapered holescoatedbare
Real channel holes narrow toward the bottom. With the hole model extended to a depth-varying opening, a bottom at 90 / 80 / 60 % of the mouth costs 1 to 4 % of pulse time on the supply-limited wafer (14.25 / 14.40 / 14.65 s against 14.05 s straight), because the lost conductance outweighs the lost area; at constant mouth density the cost is 4 to 20 %. The rule with the frustum area moves the other way; the two bracket a tapered-hole wafer. Hover a hole. Audit figure.
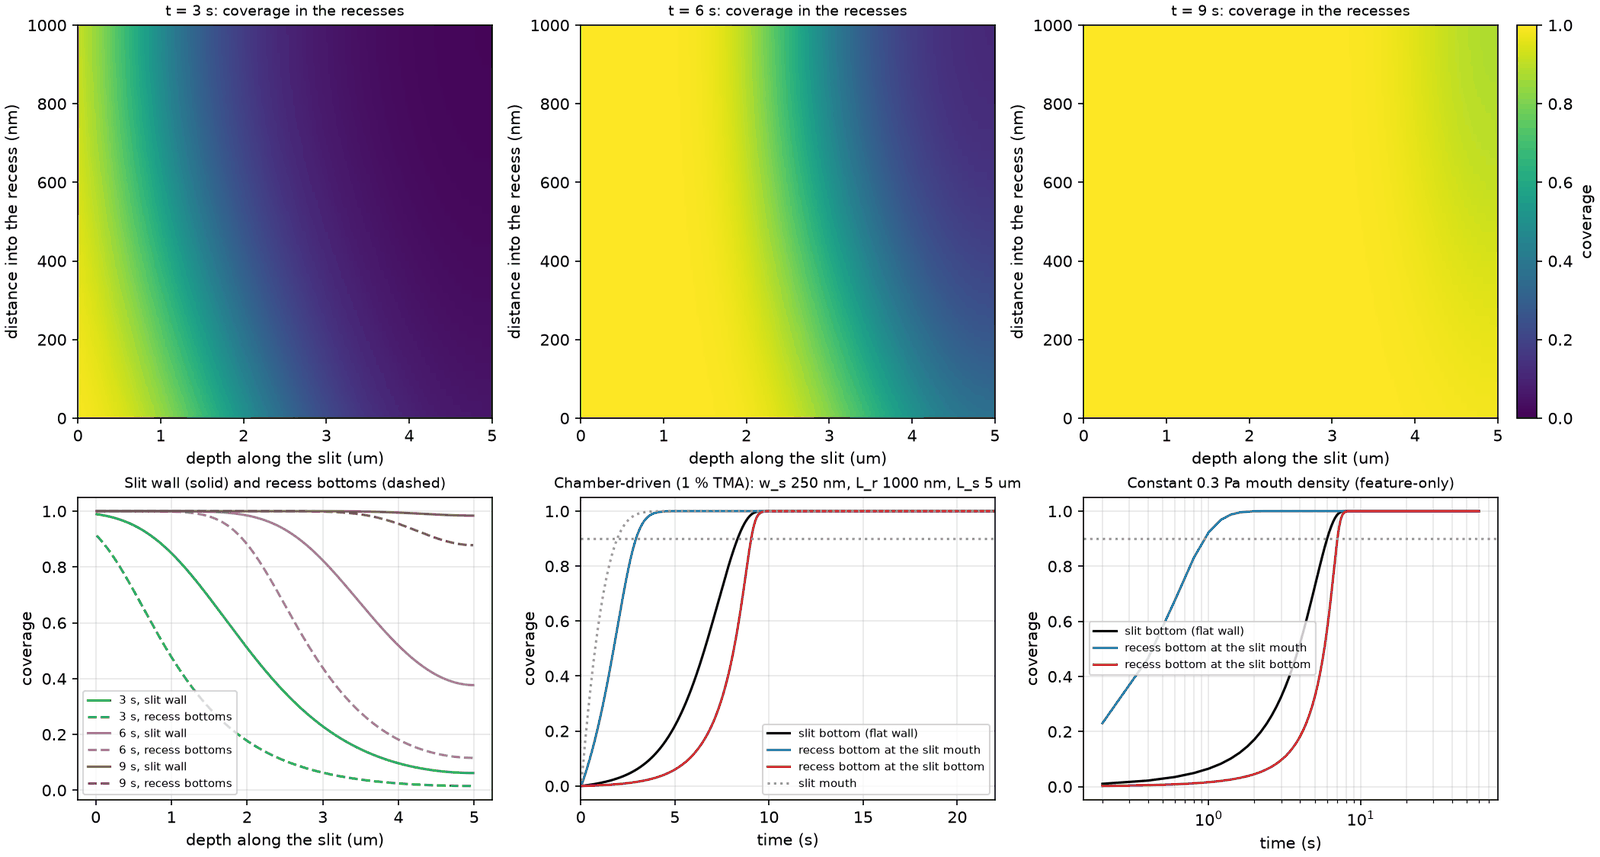
Word-line recesses filled through a slitcoatedbare
The hardest ALD step in 3D-NAND: lateral recesses (29 nm gap, 365 nm deep, 51 nm pitch) fed through a 100 nm slit 5 µm deep, modelled as nested one-dimensional problems. The last recess bottom lags the slit bottom by 0.5 to 9 % across the four geometries run, and the structure behaves as an area-equivalent slit within 4 %, so the rule's area-only treatment holds to recess aspect ratio 35. A fully patterned wafer of this kind carries 150 to 190× its area and would need 38 to 48 s at 1 % TMA. Hover a recess. Audit figure.
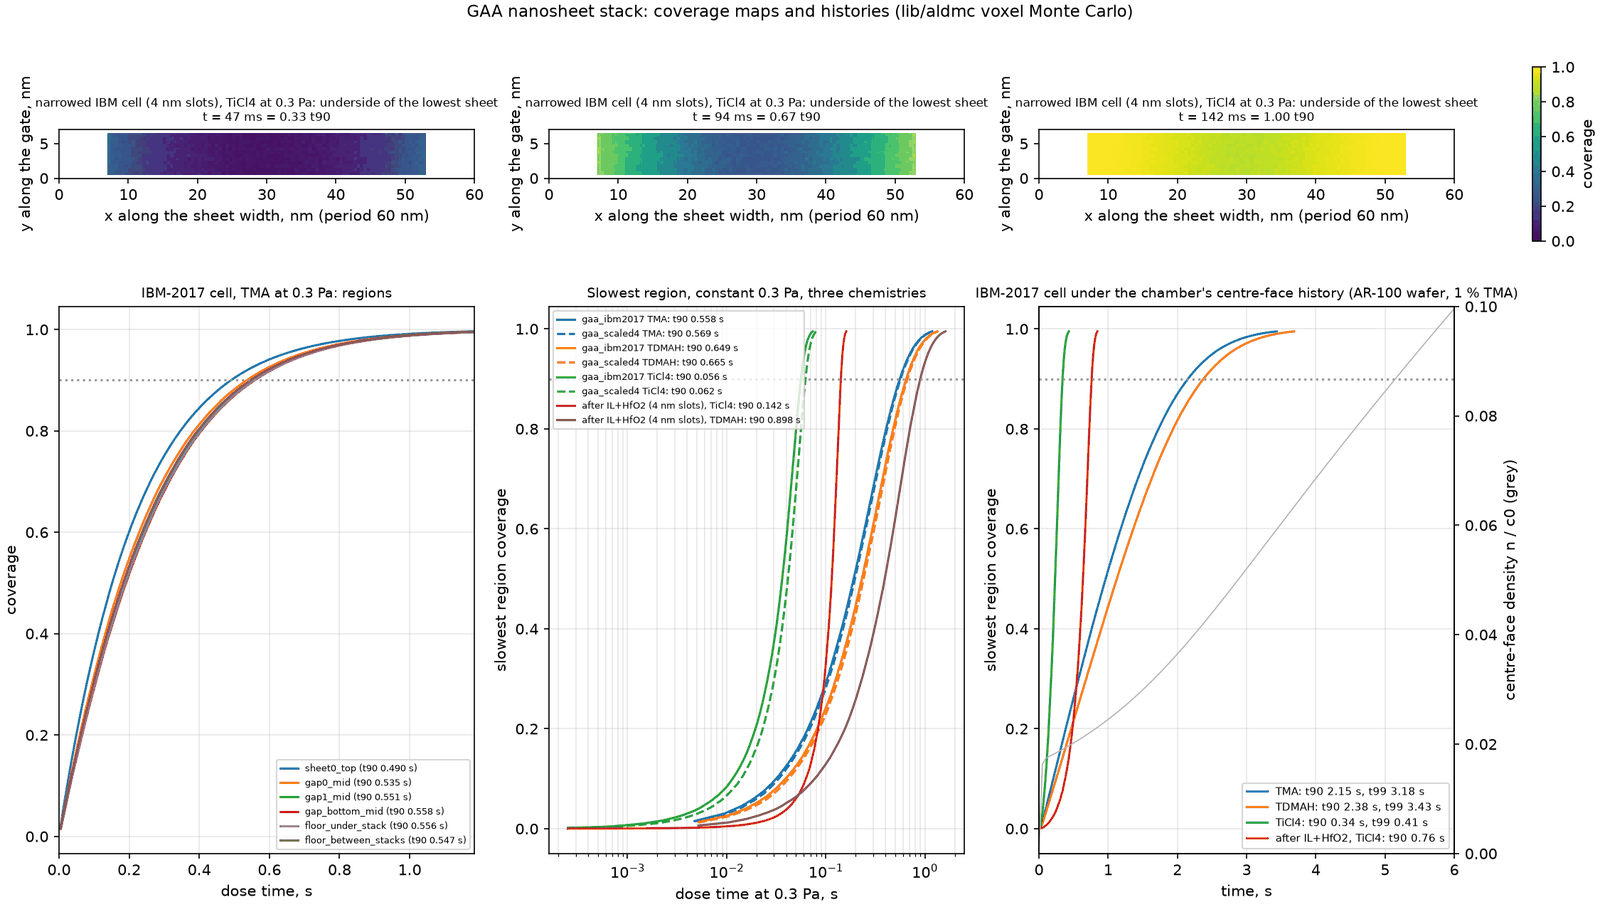
Gate-all-around nanosheets, with the 3D solvercoatedbare
—
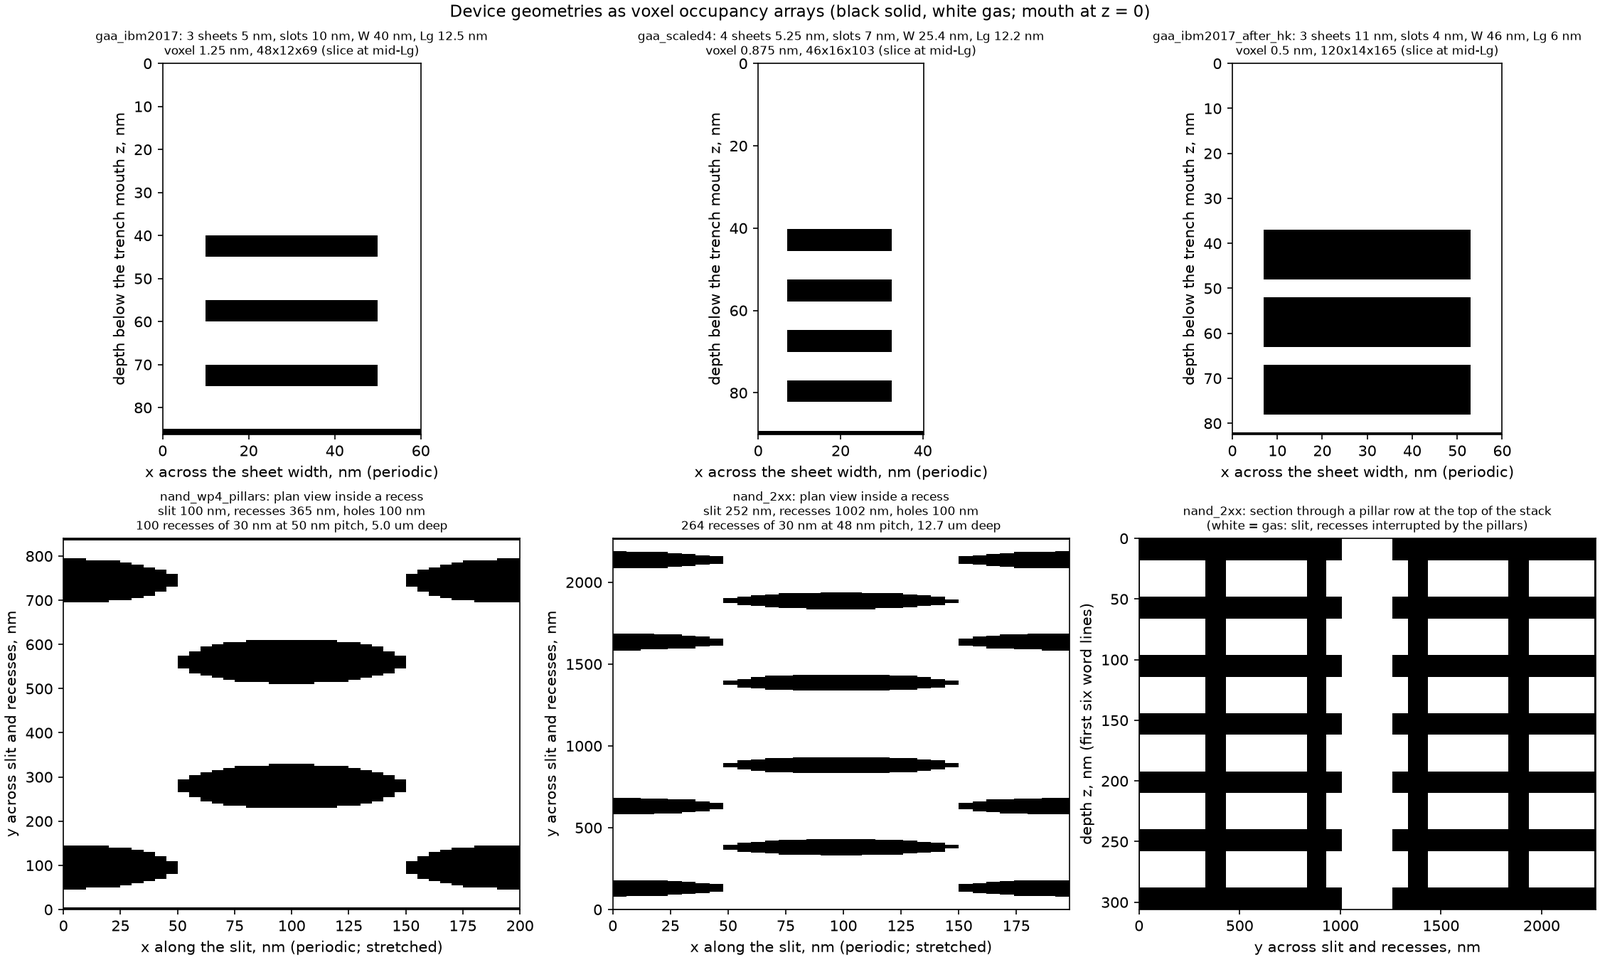
A three-sheet cell from the 2017 IBM/Samsung/GlobalFoundries stack (5 nm sheets, 10 nm slots, 40 nm wide, 12 nm gate length) and a scaled four-sheet cell, run with the voxel solver for TMA, TDMAH and TiCl₄. The last point to saturate is always the centre of the bottom slot; TMA reaches 90 % everywhere in 0.56 s at 0.3 Pa against 0.47 s on a flat surface, and with the 3 nm interfacial oxide and high-k already in place TiCl₄ in the 4 nm slot lags 28 % centre to edge. Per wafer such a stack is only 4 to 6× the flat area. No per-sheet thickness measurement is public, so this is an application of the validated solver, with the testable prediction stated: a 3 to 8 % slot-centre deficit after a one-third pulse. The scene is every exposed voxel face of the cell (8,400 faces at 1.25 nm; the narrowed cell's 36,864 faces of 0.5 nm merged to 1 nm tiles) at a third, two thirds and all of the time to 90 % everywhere; slots are drawn 3× their height and the trench above the stack at half height, so the slot interiors can be seen. Hover a face; drag to orbit. Audit figure · Geometries and sources.
A current NAND word-line cellcoatedbareslowest recess
—
A 253-gate cell at a 48 nm word-line pitch, 12.7 µm slit depth, 1 µm recesses and four rows of support pillars (TechInsights, YMTC 232L), 5.7 million exposed voxel faces. TMA saturates the slit floor in 14.6 s but the slowest recess in 33 s, and that recess sits at 87 to 90 % of the depth, not at the floor: the saturated floor reflects the stream into the lowest recesses. Per wafer the stack carries 448× its area; the rule gives 113 s at 1 % TMA, 3.4× what the 0.3 Pa cell needs, and for TiN the margin is only 17 %. The scene is the 5 µm cell with pillars (1.19 million faces) cut through its pillar row: the faces in a two-voxel slab, merged to 6,205 tiles, at 3, 6, 9 s and the end of the TMA run at 0.3 Pa, with the pillar wall coloured by its coverage per recess; the slit lies horizontally with its mouth at the left, drawn 4× wider across the slit than deep, each face 100 nm long along the slit. Hover a tile or a pillar segment; drag to orbit. figures/device_geometries.csv · Audit figure.
10 · Layout to recipe
Give it your die map; it gives you the pulse.
Describe the wafer as concentric zones (hole diameter, aspect ratio, hole density) and the chamber as the showerhead supply. The tool runs the supply rule on each zone, sizes the recipe on the most demanding one, and shows how far the wafer-average rule would have under-dosed it. The expected band under the recipe is the lateral-feed margin measured in the two non-uniform chamber runs, not a model.
#
r in, mm
r out, mm
d, nm
AR
holes / m²
density 0 or AR 0 = bare field. Zones are axisymmetric rings; the wafer is 300 mm.
Chamber
Die-density map as CSV
—recipe pulse: local rule of the governing zone
—expected saturation with the lateral-feed margin
—wafer-average rule · under-dose
—under-dose factor, local / average
zone
r, mm
pattern
wall ratio
local rule, s
expected, s
a the rule is a supply limit and under-predicts a blanket surface (kinetics set the time there); b measured flat saturation of the bare field next to the dense array in the chamber run, 0.40–0.50 s against 0.35 s on a blanket wafer; c a zone next to a denser neighbour is starved, not fed (the ramp's last holes took 5.1 s against a 0.6 s local rule), so its own rule is not a prediction; it is covered by the recipe pulse.
Calibration and limits. The recipe pulse is the supply rule t = 1.2 (1 + A_wall/A_wafer) N₀ / (U c₀) evaluated with the wall-area ratio of the most demanding zone, the same arithmetic as the calculator above. The expected band multiplies it by 0.82–0.87, the ratio of measured saturation to local rule in the two non-uniform chamber runs (dense centre 11.85 / 14.39 s; AR ramp 12.50 / 14.36 s), and by 0.98 for a uniform wafer (14.05 / 14.39 s): a calibration on two runs, not a model of lateral transport. Zones are axisymmetric rings in a wedge chamber; azimuthal layout is not represented. The rule is validated for AR 20–100 and TMA 0.5–10 %; the tool warns outside that range but still computes. Files: paper/assumptions.md (Night 3, part 1), figures/pattern_layout.csv, assets/layout-tool.js.
12 · Run the 3D solver in your browser
The voxel Monte Carlo, on your own graphics card.
Section 11 cross-checked the 1D hole model against a second, independent solver: test-particle Monte Carlo on a 3D voxel grid in the molecular-flow regime (lib/aldmc). This is that solver written as a WebGPU compute shader. Every particle is one GPU thread: it enters the mouth with a cosine distribution, flies in straight lines through the distance field, sticks with probability s (1 − θ) on the face it hits or re-emits diffusely, and the hit counts relax the coverage of every exposed voxel face. Pick a feature, press Run, and watch the floor saturate against the number the paper quotes.
Nothing has loaded yet: the solver module, the shader and three.js are fetched when you press Run.
Hole AR 20 · coverage of every exposed voxel faceθ 01
Press Runthe feature appears here as its exposed voxel faces, coloured by coverage; drag to orbit
—floor t₉₀, live · reference 1.148 s (lib/aldmc, 16 across, dt 5 ms; Machball 1.158 s)
0 %floor coverage
0.000 ssimulated time
—backend
—particles per second
—flights (voxel segments) per second
0particles traced · escaped / stuck / left
What runs where. The physics is that of lib/aldmc (molecular flow; cosine entry over the open mouth; sticking s w (1 − θ) on the face's own coverage; loss r; diffuse re-emission about the facet normal; escape through the mouth; N₀ h² w sites per face with the staircase area correction w; a step of M particles standing for n v̄/4 Amouth dt molecules; the Langmuir relaxation of the per-face collision count). The shader (assets/aldmc-gpu.wgsl) runs on your graphics card through WebGPU, one compute invocation per particle with its own xoshiro128** stream and atomic per-face counters; a second pass applies the coverage update. If navigator.gpu is missing (WebGPU is in Chrome, Edge and Safari 26, Firefox on Windows and behind a flag elsewhere) the same algorithm runs in plain JavaScript on one CPU thread (assets/aldmc-cpu.js): the same statistics, ten to twenty times slower. Results are statistical: the floor t₉₀ scatters by a few tenths of a per cent between seeds at the reference budgets and more at small M; the time step enters linearly through the coverage frozen within a step (0.6 % at the reference dt). The reference values are the paper's voxel runs at 16 voxels across (paper/wp/wp9_voxel_mc.md, 0.3 Pa TMA, 300 °C, s 5·10⁻³, N₀ 4·10¹⁸ m⁻²); the GAA preset is the three-sheet IBM 2017 cell of paper/wp/wp10_device_geometries.md (5 nm sheets, 10 nm slots, 40 nm wide, 12.5 nm gate trench, periodic at 60 nm), run with plain voxel faces as in the paper, and its live number is the centre of the bottom slot, the last point of that structure to saturate (0.558 s against 0.474 s on a flat surface). What the demo is not: the film does not narrow the opening as it grows, and there are no gas-phase collisions by construction (Kn ≫ 1 inside the features); the time step scales with N₀, pressure and temperature but not with s, so change dt by hand when you change s.