01 · Diagnosis
The inlet was the problem, not the chemistry.
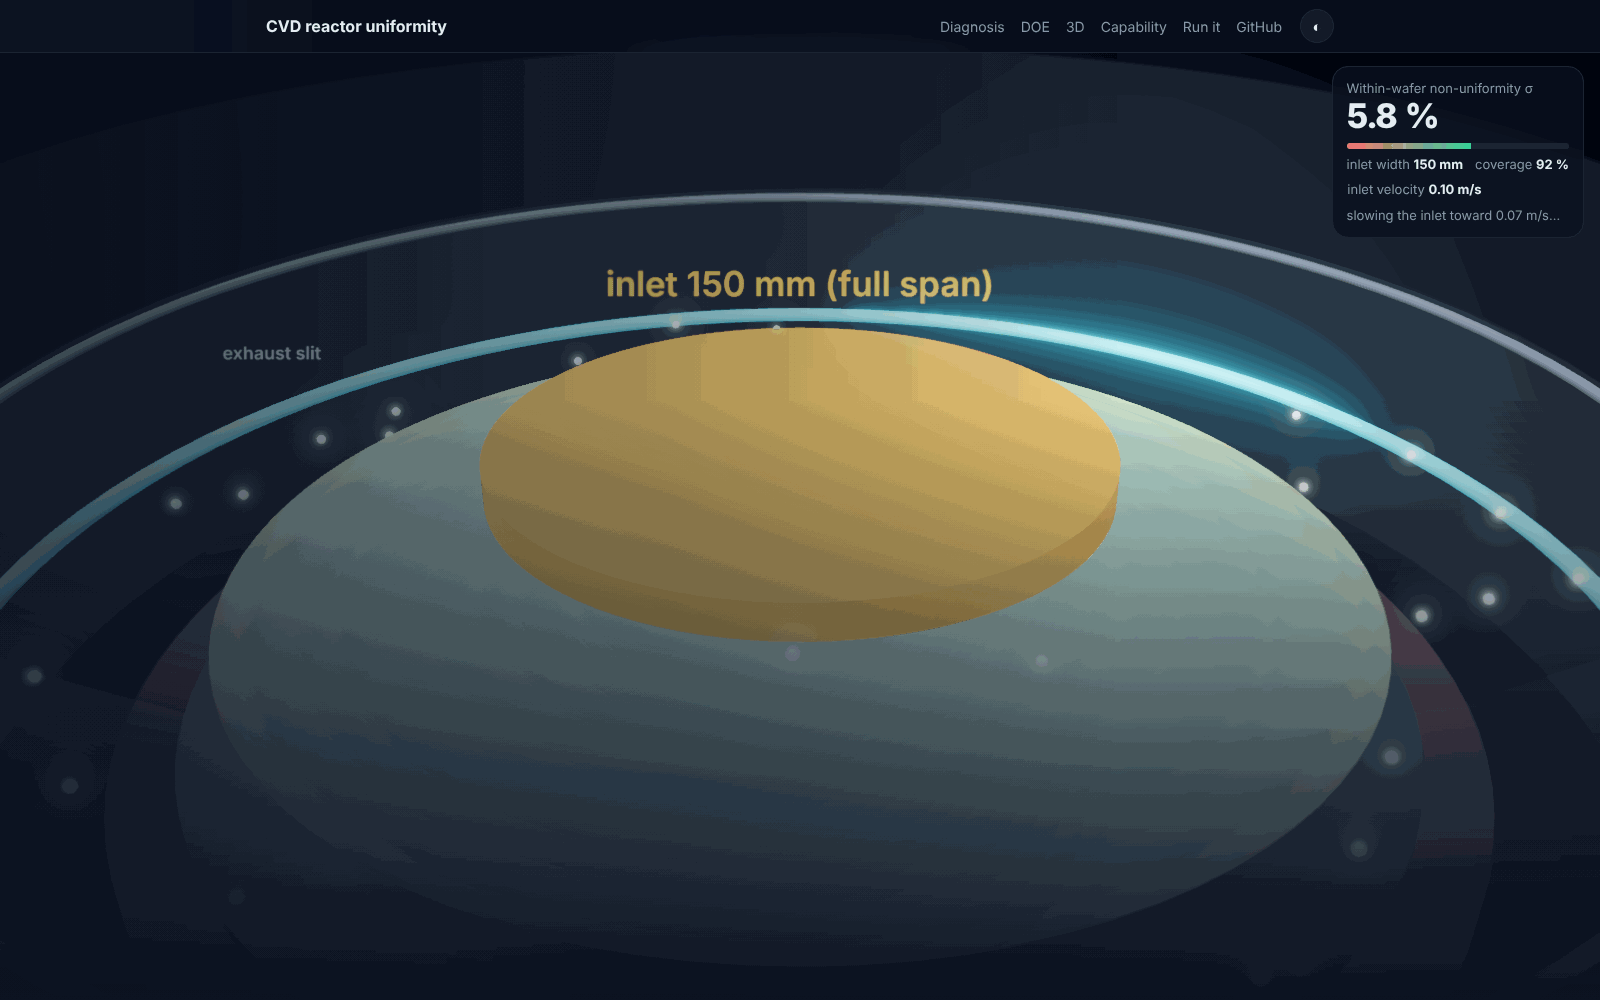
With a 10 mm central inlet the Damköhler number, surface consumption over convective supply, sat above 10. The precursor was consumed within the first 25 mm of radius and the outer 83 % of the wafer saw almost nothing. Widening the inlet to the wafer diameter, the ratio a Mitsubishi Electric gas-head patent uses, cut σ from 179.6 % to 6.1 % and raised coverage from 17 % to 92 % at the same flow. Nothing else changed.
The reactor, explodedshowerhead inlet300 mm waferexhaust slit
Wafer-plane concentration, three states10 mm inlet150 mm, 0.10 m/s150 mm, 0.07 m/s
| 10 mm inlet | 150 mm, 0.10 m/s | 150 mm, 0.07 m/s |
|---|
| σ, coefficient of variation of wafer-plane concentration (r ≤ 138 mm) | 179.6 % | 6.1 % | 3.3 % |
| Coverage: radius where c falls to 10 % of peak | 16.9 % | 91.9 % | 91.9 % |
| Regime | mass-transfer limited, Da ≈ 13 | near-uniform supply | edge rise from exhaust only |
Model: 2D axisymmetric chamber, 300 mm wafer, 20 mm wafer-to-inlet gap, sidewall exhaust; laminar flow, heat transfer and dilute-species transport coupled; N₂ carrier with temperature-dependent properties; a silane-like precursor with Arrhenius surface kinetics from the silane CVD literature and first-order consumption at the wafer. Steady-state concentration at the wafer plane is the deposition proxy. Precursor utilisation is 0.17 % in the baseline; uniformity was the objective of this study.
02 · Designed experiment
Inlet velocity sets uniformity. Wafer temperature does not.
A face-centred central composite design over inlet velocity and wafer temperature, 14 COMSOL runs on the full-span geometry, extended with axial points down to 0.02 m/s once the optimum was seen to lie below the design centre. Every run is an exported wafer-plane profile in the repository.
Wafer-plane profile
u_in = 0.20 m/s, T_wafer = 1000 K
15.7% σ
0.20 m/s: too fast
At the top of the design the jet from the showerhead overshoots the centre and the profile tilts: σ = 15.7 %.
0.125 m/s: the design centre
Halfway down the velocity range σ is 6.1 %, the same as the first full-span run. Temperature at 900 or 1100 K moves it by 0.1 point.
0.07 m/s: the optimum
σ = 3.3 % with 92 % coverage. The residual is an edge rise from the proximity of the exhaust slit, not starvation.
0.035 m/s: starting to starve
Below the optimum the supply thins and σ climbs back to 4.3 %.
0.02 m/s: starved again
σ = 7.7 %. The window is 0.035 to 0.10 m/s, and inside it temperature can be used to set throughput through the surface rate constant without spoiling uniformity.
Temperature: 900 → 1100 K at 0.05 m/s
σ = 3.29, 3.38 and 3.44 %. Velocity and temperature are decoupled, which is the result a process engineer wants: one knob for uniformity, one for rate.
The response: σ against inlet velocity at three wafer temperatures900 K1000 K1100 K
03 · What 2D cannot see
Three exhaust ports put a ±10 % ripple on the wafer.
A real reactor is built with discrete exhaust ports. A 3D model with three of them reproduces the radial trend and adds an azimuthal ripple tied to the port positions. The surface below is the actual COMSOL export: 6,012 wafer-face nodes, height and colour both equal to concentration over its mean.
3D wafer face, 6,012 nodesCV 7.9 % full face · 5.9 % excluding a 5 mm rim · drag to rotate
Architectures and sensitivity checksat or near the optimumworse than the single inlet
The 3D wafer-face value is a surface, over-area coefficient of variation reported alongside the radial σ of the 2D runs.
04 · Process capability
A surrogate you can propagate tolerances through.
A Gaussian-process surrogate fitted to the 14 runs validates at leave-one-out R² = 0.944 (a second-order polynomial gives 0.917). Propagating sourced equipment tolerances through it, mass-flow controller ±1 % of setpoint and a Type K class 2 thermocouple ±5.5 K at 1000 K, with 10,000 Monte Carlo draws at 0.06 m/s gives an expected σ of 3.34 % with a spread of 0.006 %.
| Spec (poly-Si film-thickness non-uniformity) | Limit | Verdict |
|---|
| Undoped poly-Si, University of Waterloo QNC LPCVD facility | 3.0 % | just above: 3.34 % expected |
| Doped poly-Si, same facility | 10.0 % | far inside |
Scope and assumptionsThe Monte Carlo spread is propagated input uncertainty through a deterministic model, the standard way to estimate a process window before a tool exists; the spec is the published LPCVD figure for the same chemistry family.
Thirteen modelling questions were tracked to closure before the redesign was trusted; ten were resolved with citations, two are proprietary and handled as declared simplifications, one (wafer rotation) was kept out because the only available numbers belong to a different reactor class. The table is in the repository under docs/Open_Questions_Resolved.md.
05 · Reproduce it
Every number from the exported profiles, in one command.
git clone https://github.com/Soham-ChemE/CVD-Reactor-Uniformity-COMSOL.git
cd CVD-Reactor-Uniformity-COMSOL
pip install -r requirements.txt
./reproduce.sh     # σ and coverage for every export, 3D wafer statistics, surrogate + Monte Carlo, figures, this page's assets
The three .mph model files open in COMSOL Multiphysics 6.4 or later; the exports in data/ are what every script reads, so the analysis runs without a COMSOL licence.